Debugging a Delphi Lockup with Windbg
While the Delphi debugger is quite good, there are some instances when it isn’t quite good enough.
- Your application is crashing remotely The worst place for an application to fail is when there is no debugger available. Usually these problems can be corrected via the “Works Fine Here” solution. Unfortunately most bug-tracking systems lack this option to close tickets.
- Lack of symbol information The best trace you can get in the debugger shows a thread balls deep into Windows API calls for no apparent reason. Some resolution can be gained from the DLL export addresses but without proper symbol information this isn’t enough detail.
The solution to both these scenarios is to use Microsoft’s free debugger WinDbg, available as part of the Debugging Tools for Windows package. You’ll need the version for the host platform where the trace will occur. This means get the 64-bit if you’re debugging on Win64 even if your app is 32-bit. You’ll also need the map2dbg utility, originally by Lucian Wischik.
Prepare Your Project
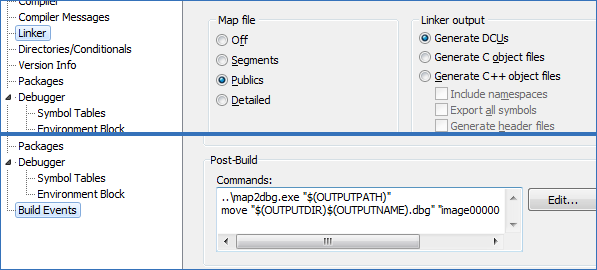
First, you’ll need to prepare your project so that it exports its symbols to windbg, which is going to run externally from Delphi. To do this you need to change the Linker options to generate a map file with a list of Publics. Compile your app and run map2dbg against the exe to generate a .dbg file. You can have Delphi automatically do this for you adding a Post-build step to the project options. If you’re debugging a 32-bit application under a 64-bit environment however, windbg expects the dbg file to be named image00000000`00400000.dbg so that can be added as well. DLL .dbg files can stay the same as the module name.
C:\SysTools\map2dbg.exe "$(OUTPUTPATH)"
move "$(OUTPUTDIR)$(OUTPUTNAME).dbg" "image00000000`00400000.dbg"
Using WinDbg
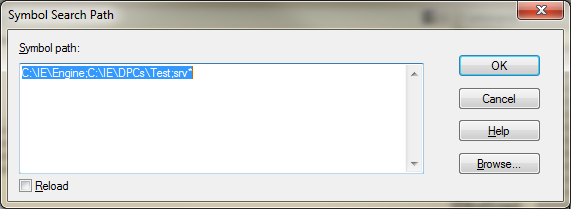
Fire up windbg and launch your application using File | Open Executable…. Now set your Symbol Path from the File menu as well. Start with the directory where your application’s .dbg file is located, then any DLL .dbg files, and finish with “srv*”. This special token instructs WinDbg to use the Microsoft symbol server, which will automatically download the symbols you need and cache them in %ProgramData%\sym\dbg.
If you’re having problems getting your application’s symbols located, turn on noisy symbol loading and windbg will give trace where it is looking for each .dbg file.
0:008:x86> !sym noisy
noisy mode - symbol prompts on
0:008:x86> .reload
The hotkeys are standard Microsoft versions so that means F5 means run, or type ‘g’ into the command window. For this example I’ll be debugging a 32-bit lockup on my 64-bit development system. Once I’ve got my application wedged, hit the pause button. If your development environment is the same as mine, the first thing you’ll notice is that all your threads are in the wow64cpu dll:
0:001> k
Child-SP          RetAddr           Call Site
00000000`0069f0f8 00000000`74db282c wow64cpu!CpupSyscallStub+0x9
00000000`0069f100 00000000`74e2d07e wow64cpu!WaitForMultipleObjects32+0x32
00000000`0069f1c0 00000000`74e2c549 wow64!RunCpuSimulation+0xa
00000000`0069f210 00000000`773ed177 wow64!Wow64LdrpInitialize+0x429
00000000`0069f760 00000000`773a308e ntdll! ?? ::FNODOBFM::`string'+0x2bfe4
00000000`0069f7d0 00000000`00000000 ntdll!LdrInitializeThunk+0xe
This is because windbg always shows the architecture of the context where the break occurred. If you hit Pause, you get 64-bit. If a breakpoint in your code pops, you get 32-bit. Luckily, the you can toggle architectures using the wow64exts extension by typing !wow64exts.sw, or simply !sw.
0:008:x86> k
ChildEBP RetAddr
04daf56c 770b0816 ntdll32!NtWaitForSingleObject+0x15
04daf5d8 76211184 KERNELBASE!WaitForSingleObjectEx+0x98
04daf5f0 76211138 kernel32!WaitForSingleObjectExImplementation+0x75
04daf604 763188df kernel32!WaitForSingleObject+0x12
04daf628 7643a819 ole32!GetToSTA+0xad
04daf658 7643c05f ole32!CRpcChannelBuffer::SwitchAptAndDispatchCall+0x140
04daf738 7632d0e5 ole32!CRpcChannelBuffer::SendReceive2+0xef
...
Ah that’s better. Now we see a common problem, a COM object is trying to call into an STA and when something hangs like this, it is generally because the STA has stopped pumping messages (calls to STAs are serialized using windows messages). Let’s do a quick check to see what the threading model of this blocked thread is, which requires a little inside knowledge of how the windows keeps track of OLE threads. When you call CoInitialize()/CoInitializeEx() for the first time on a thread, the threading model you request is stored in the thread’s Thread Environment Block or TEB. Sidenote: Windows95 called this the Thread Information Block (TIB), and you’ll sometimes see the terms used interchangably although some of the data contained in the block differed between the 95 and NT platforms. This structure is allocated by COleTls::TLSAllocData and is stored at offset 0xf80 in the TEB, and the offset of the threading flags is at 0x0c in the structure. From this knowledge, I can use !wow64exts.info to get the TEB address, add 0xf80, dereference that pointer then inspect the flags to determine the threading model. Note that I use 0x notation for hexadecimal values for clarity, but windbg always takes numbers to be hex anyway so the 0x is optional.
0:008:x86> !wow64exts.info
...
TEB32: 0x7efa0000
0:008:x86> dd 0x7efa0000+0xf80 L1
7efa0f80  006cf638
0:008:x86> dd 0x6cf638+0x0c L1
006cf644  00000143
Using some more Win32 knowledge, I happen to know that the TEB is also pointed to by the Frame Segment pointer. I can use this information, the POI() debugger macro, and my ability to count to 0x0c to reduce this operation to a single quick command.
0:008:x86> dd poi(fs:f80)
006cf638  00000000 00000000 00000000 00000143
In these flags, if the bits 0x140 are present, the thread is in the MTA. If the bits 0x080 are present, the thread is an STA. If you get ????????, this means that CoInitialize() has not been called. The flags here are 0x143, indicating MTA. So our thread here is MTA, trying to call an STA. Lets look further into the backtrace to see which thread this is and where my code ends and OLE32 begins.
0:008:x86> k
ChildEBP RetAddr
...
04daff08 00510119 ScriptDPC!ScriptHost.TScriptHostImpl.Unlock+0x6
04daff30 0054a986 image00000000_00400000!DPCHandler.TDPCHandler.DoShutdown+0x35
04daff74 004055e6 image00000000_00400000!MsgConBase.TMsgConBase.ActionShutdown+0x36
04daff88 76213677 image00000000_00400000!System.ThreadWrapper+0x2a
The last bits of my code are in the ScriptDPC dll, so I’ll set a breakpoint in the Unlock method to step through and see what’s going on.
0:008:x86> bp ScriptDPC!ScriptHost.TScriptHostImpl.Unlock
Syntax:         Module     Unit         Class      Method
Use bp to create a breakpoint, bl to list them, and bc to remove (clear) one. Single stepping through the function shows that while clearing up the script context, global COM objects referenced by the script are getting released. Hrm, so it seems one of our COM objects is being Release()d by this thread but it was created by an STA so OLE is being nice and trying to RPC to that thread to release the interface. All inter-apartment calls are considered RPC regardless of their activation context, be they in-process, out-of-process, or on another machine activated by DCOM/COM+. Looking through all of my threads using the method above, I see only one is an STA, the main thread. So what I am probably looking for is the main thread creating a COM object in my script and not releasing it, which gets deferred until the script context is deleted.
To find where this occurs is a bit more tricky, so I examine the points where the UI might interface to my scripting component. While poking around examining the interactions, I notice this DLL load trace coming up in the debugger when I execute a context menu a certain component:
C:\Windows\SysWOW64\RpcRtRemote.dll
c:\IE\DPCs\Test\DBServices.dll
The first line there indicates that the RPC engine is being loaded into my process. This creates an MTA thread and a pool of worker threads to service method invokations for objects and is a dead giveaway that the UI’s STA thread has just created a free-threaded object, the calls to which must be marshalled cross-apartment. Some quick tracing through the source code turned up this bit of code being called from the main thread:
procedure TScriptDPCBase.ScriptScriptObjectsNeeded(Sender: TObject);
begin
  RegisterScriptObject('IEProxy', IEProxy);

  if not Assigned(FDBServices) then
    FDBServices := CoCDataBaseServices.Create;
  RegisterScriptObject('DBServices', FDBServices);
end;
CDataBaseServices is flagged as tmFree. There’s our MTA object. A little rearranging moved the CDataBaseServices creation to the initialization of the script thread, make sure it isn’t being accessed by the UI, and lockup solved.


[…] Uncategorized « Debugging a Delphi Lockup with Windbg […]